
In 2018, Tucows launched our Tiered Access Compliance and Operations (TACO) platform to manage registration data disclosure requests. From the start, we’ve tracked the requests we receive and committed to publishing this data to promote transparency around access to registrant information. In this post, we’re not only sharing our most recent TACO statistics, but taking a look back at how request and disclosure rates have changed over the years.
Request rates 2018 – 2025
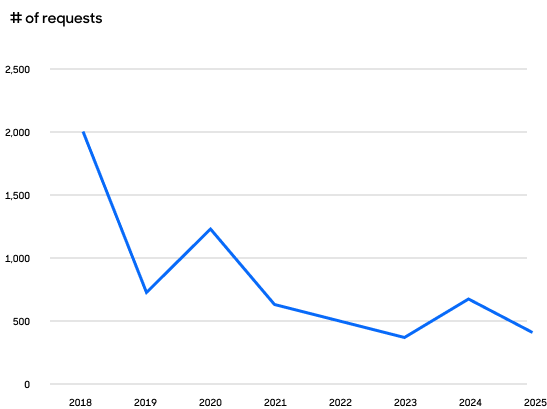
Total requests by year
Over our eight years of operating TACO, we have seen an overall decline in request rates from just over 2000 requests in 2018 to just under 500 requests in 2025. This includes requests that were submitted through ICANN’s pilot program, RDRS as well as those submitted through TACO directly. It’s important to note, as we did at the time, that the initial influx of requests in the first few months of TACO’s existence came from one particular requestor.
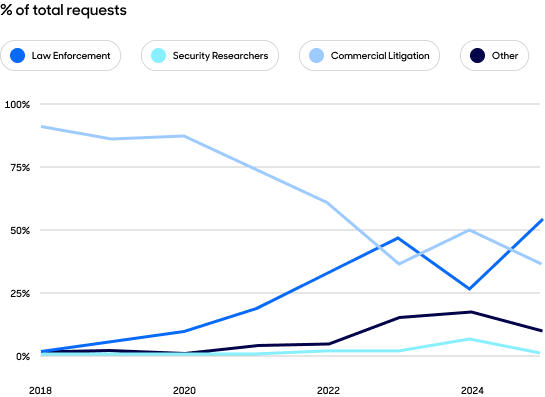
Total requests by category
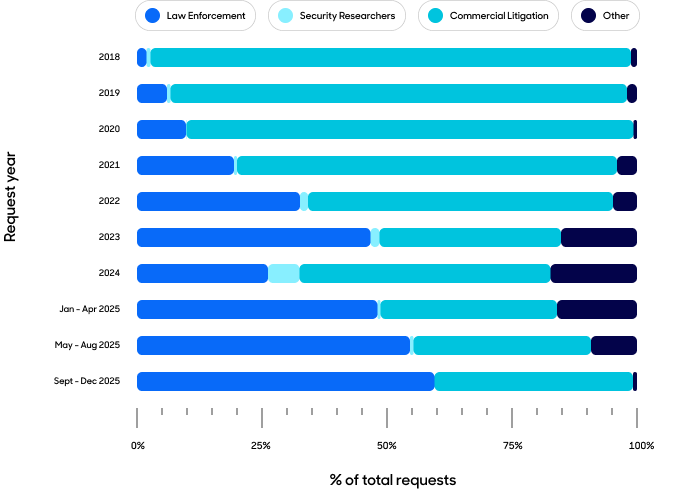
If we look by requestor category, we see that, while Commercial Litigation was at first the primary requestor group, recently law enforcement requests have increased and taken the lead.1
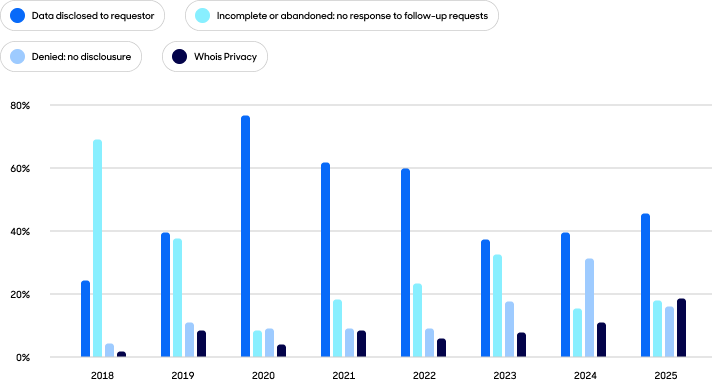
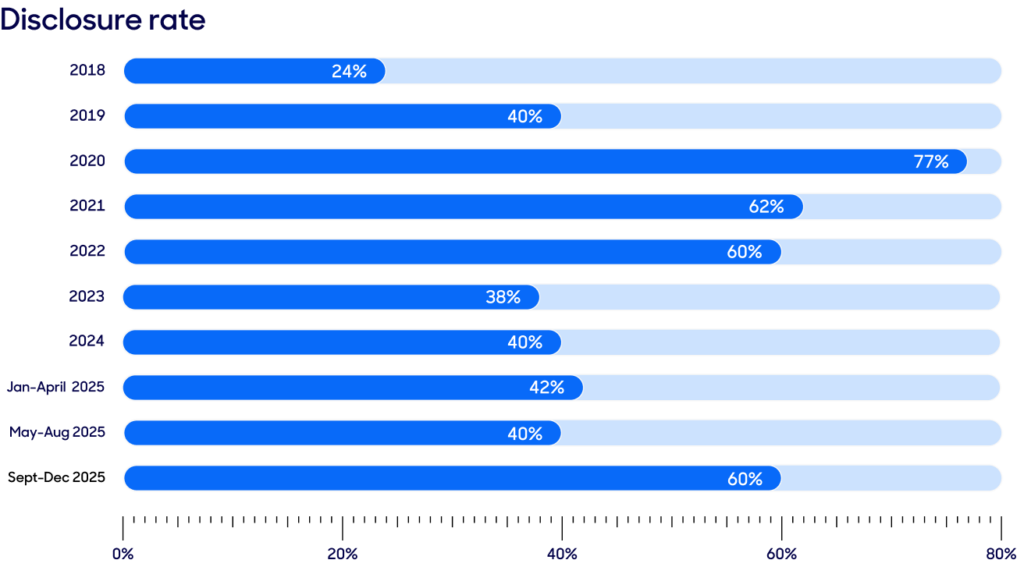
Disclosure trends
Our disclosure rate peaked at 77% in 2020, the same year that the total number of requests was at its height. This followed a volatile first couple of years during which we devoted significant resources to educating requestors on how to provide comprehensive packages so that their requests could be reviewed.
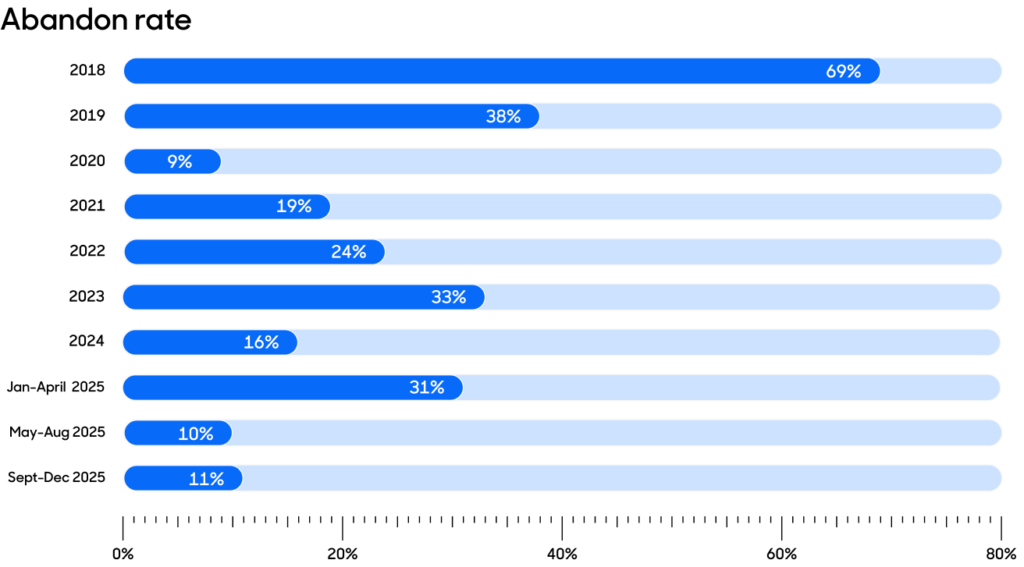
With abandoned requests, we saw almost the reverse: the abandonment rate was highest that first year, while, in later years, it evened out. The trend remains that the majority of requests result in disclosure of information, indicating that this system is working: people are getting the information they need, and we are continuing to balance the rights of the requestor against the rights of the data subject.
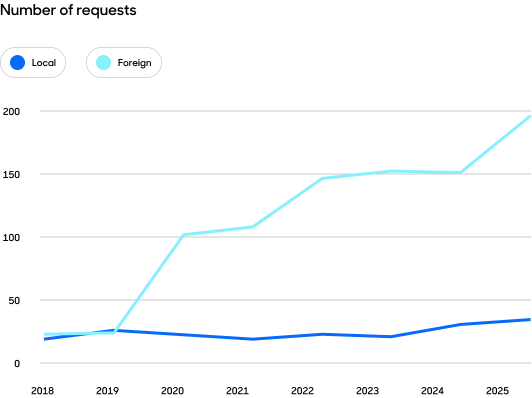
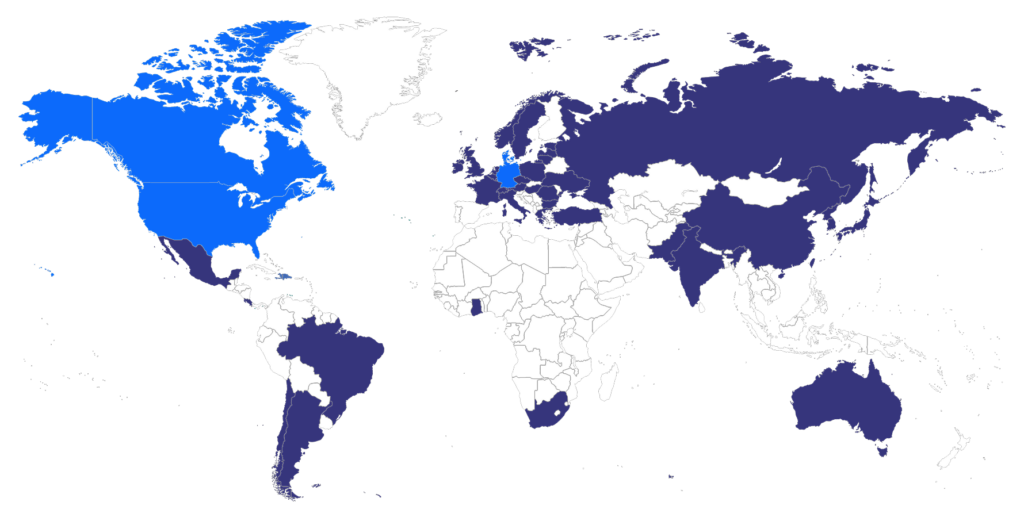
Local and foreign law enforcement request trends
LEA request origin (local vs foreign)
In June 2024, we first shared data about where law enforcement requests come from. We divide law enforcement agencies (LEA) into two broad categories: “local” for the countries where we have corporate offices (Canada, Denmark, Germany, and the United States), and “foreign” for LEA from all other countries. This is because the way we respond to local requests is slightly different from the way we manage foreign requests. When requests come from local law enforcement, we want to both maintain good relationships and meet our legal obligations. When requests come from foreign law enforcement, on the other hand, legal requirements may be quite different, and we have an even greater obligation to ensure that due process and data protection are maintained and respected.
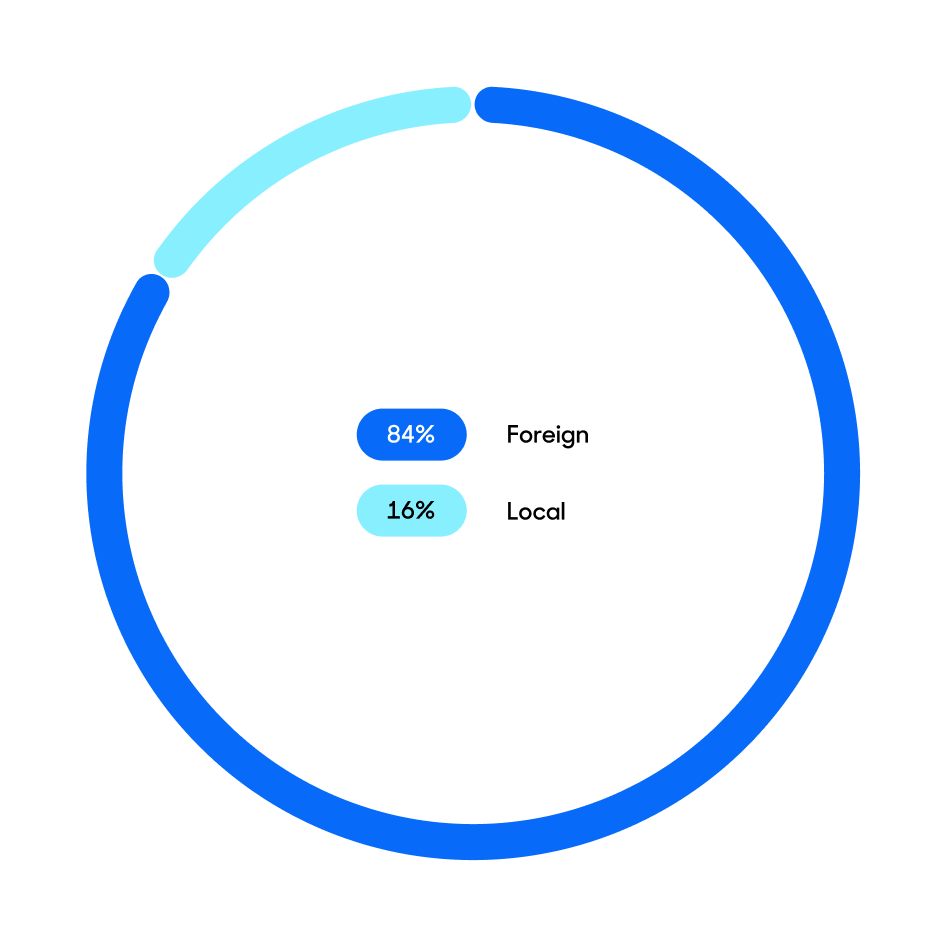
The overall requestor breakdown—about 85% foreign and 15% local—remains the same now as it was when we first reported on it. However, as you’ll see in the next chart, we have noticed a recent increase in local LEA requests from one of our local jurisdictions.
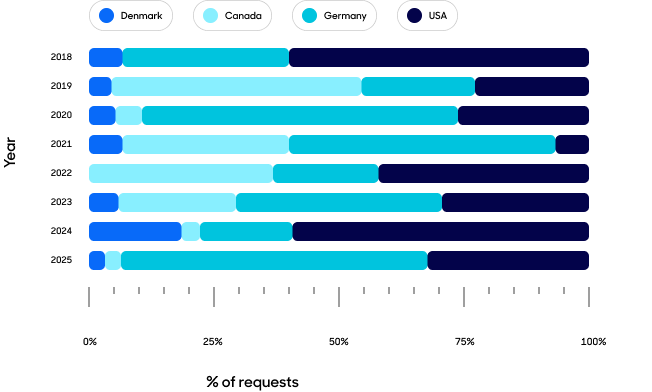
Local LEA request breakdown (overall)
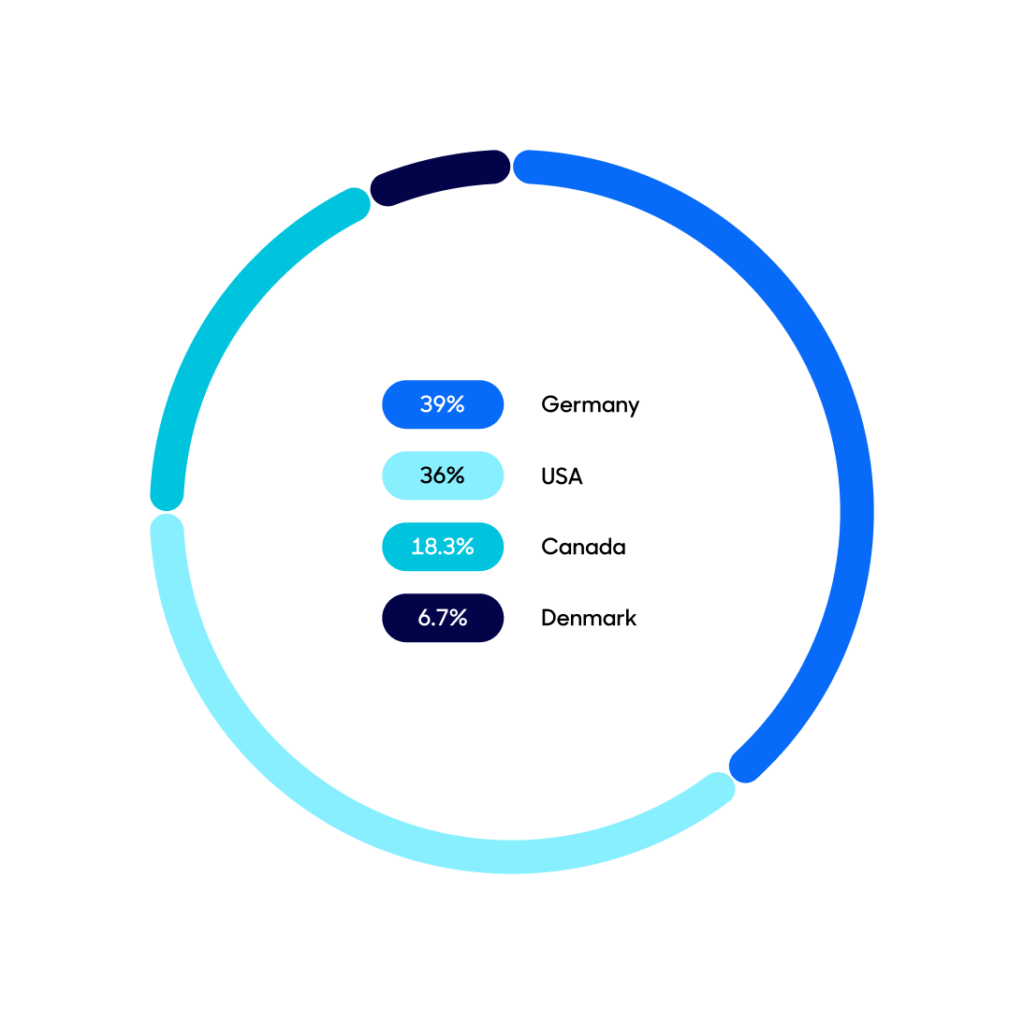
Breaking down local law enforcement disclosure requests by country shows that the United States most frequently submits the highest number of requests, though Germany has led in some years. Canada also ranked first in one reporting period.
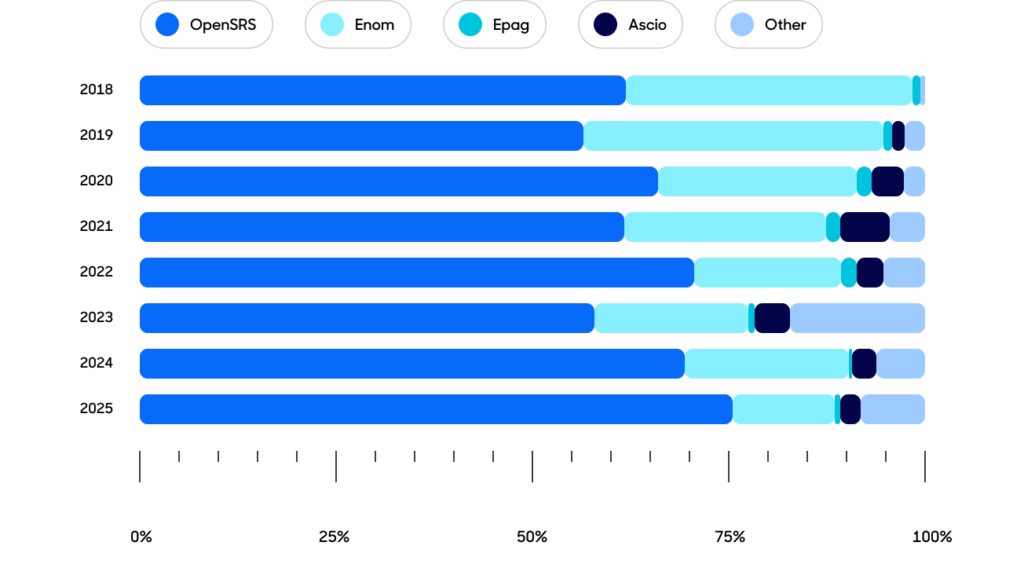
Requests by business line
The differences in request rates across our Tucows registrar brands may simply be attributable to the business size—OpenSRS is the largest of our accreditations, so it makes sense that it would receive the most requests. We also record requests that fall into an “Other” bucket—mostly comprised of misdirected requests intended for a registrar that isn’t part of the Tucows family. While the annual volumes of “Other” requests have fluctuated, we’ve seen an overall increase in this category. We consider the “Other” bucket to be a source of pride: we’ve built the most recognizable and accessible previously-public Whois disclosure request system on the Internet, and it shows.
Remember, you can always look back through the Tiered Access blogs to see the stats for each reporting period (there are three per year) and our deep dive into the policy-related topic we found relevant at the time. Our favourites are this 2022 post about due process, this 2023 post about Urgent requests, and our recent review of Whois Privacy services and proxy registrants.
Tiered access statistics: 1 September – 31 December 2025
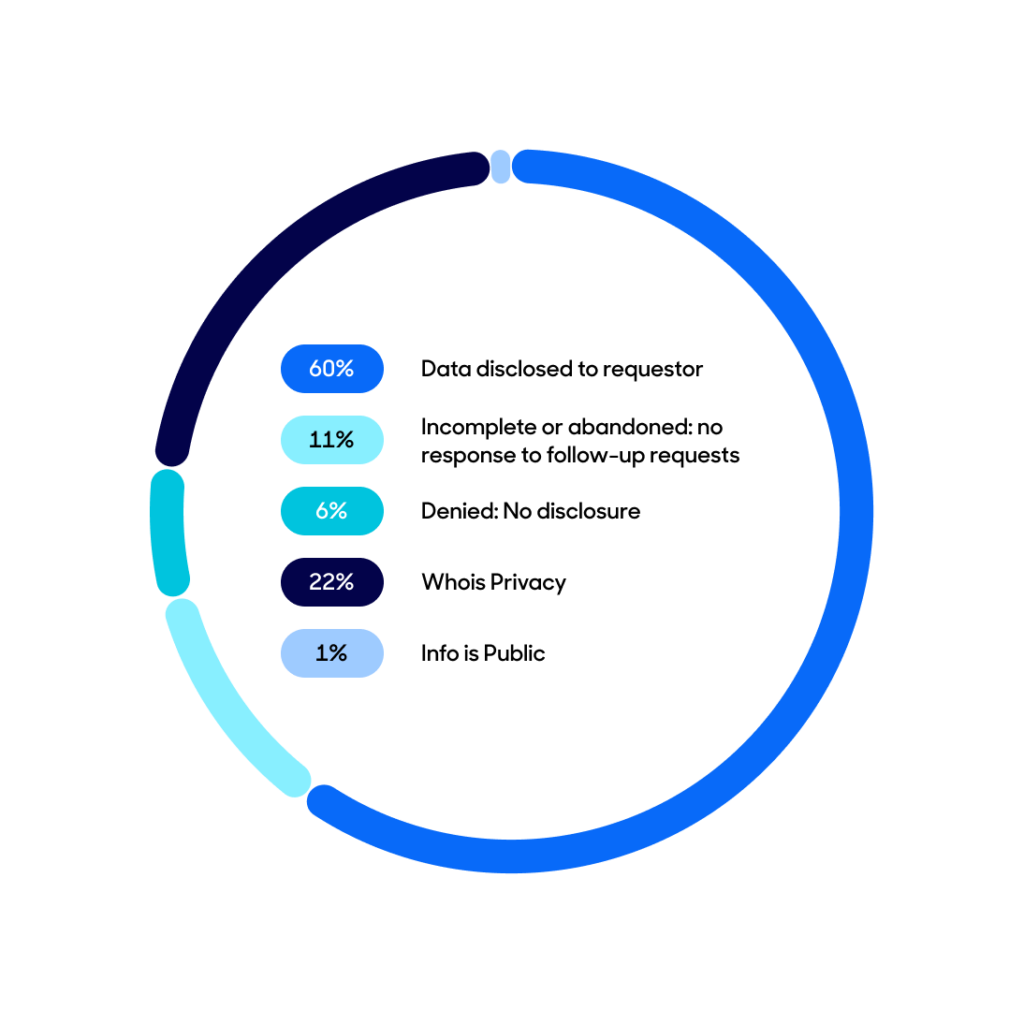
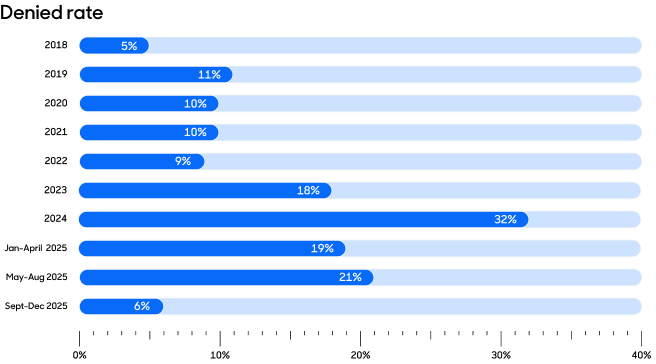
We received 116 requests in this period, bringing the total since we began tracking to 6640. Denials are the lowest they’ve been since 2018, at only 6% of the total, while disclosures increased to 60%, a rate they haven’t seen since 2022. We see this as a success of education and adoption of the RrSG’s Minimum Required Information for Whois Data Requests document—we are getting higher quality requests that demonstrate a clear need for the data.
Data disclosure request outcomes: new period (September – December 2025)
Urgent requests
We wrote about Urgent requests earlier this year and intend to continue to track them moving forward.
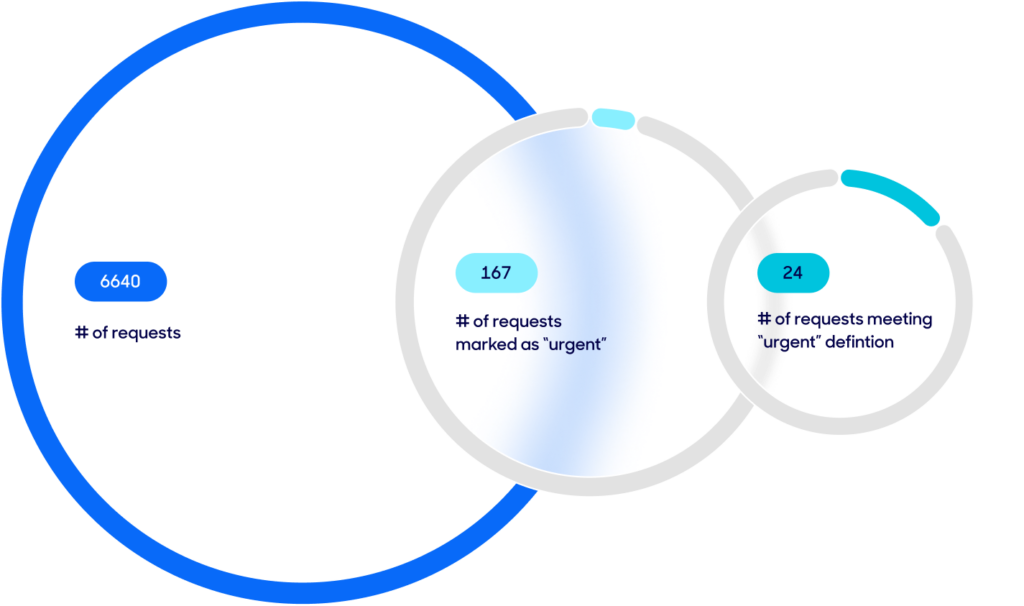
In the new reporting period, we received 4 requests marked “Urgent.” However, those four requests related to fraud investigations and did not meet the definition of Urgent. We also received one request that was not marked Urgent but related to a situation that did meet the definition; the data was disclosed accordingly.
Requests by requestor category
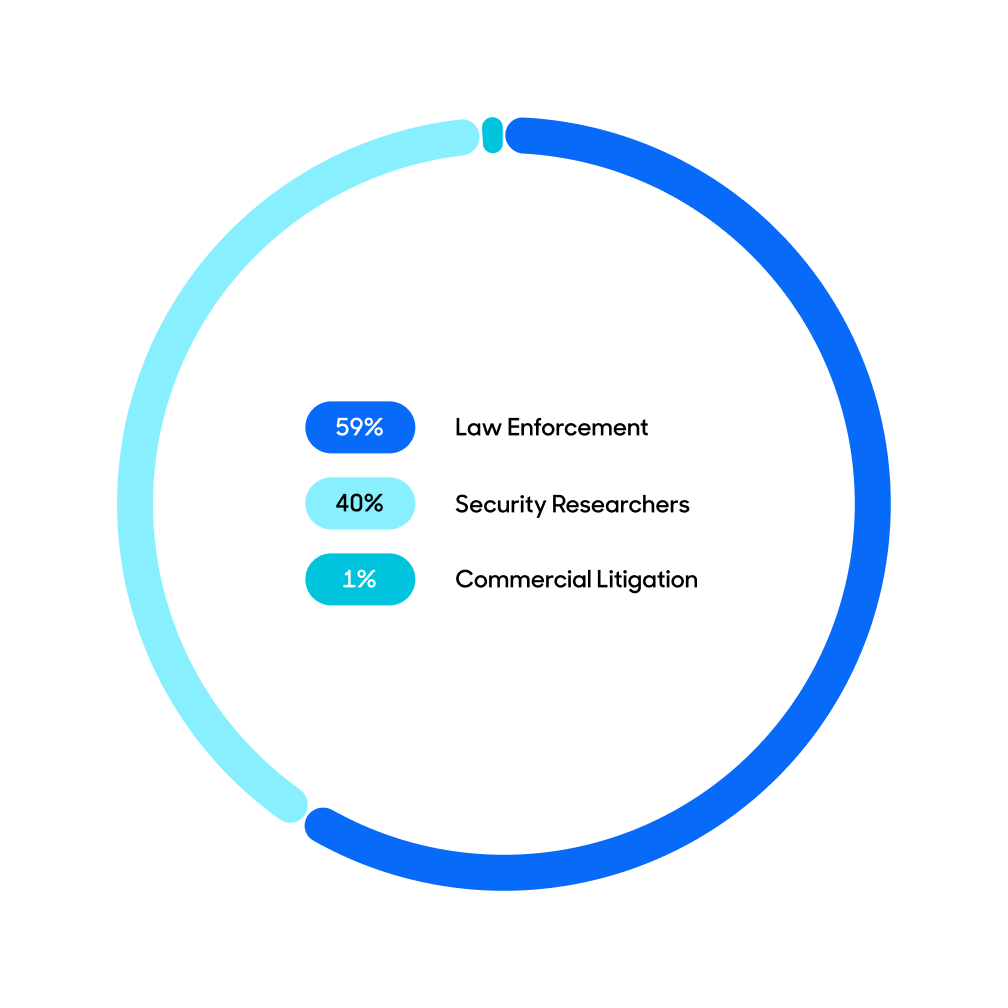
Requests by category: new period (September – December 2025)
Law enforcement requests were once again the most frequent requestor category in the reporting period, continuing to outnumber Commercial Litigation. But, given our experience over the last five years, we expect that it will shift again. Outside those two groups, we received only one request in this reporting period; it was a request to contact a domain owner with an unsolicited purchase offer, so we provided instructions on how to do so directly.
Requests by category since 2018
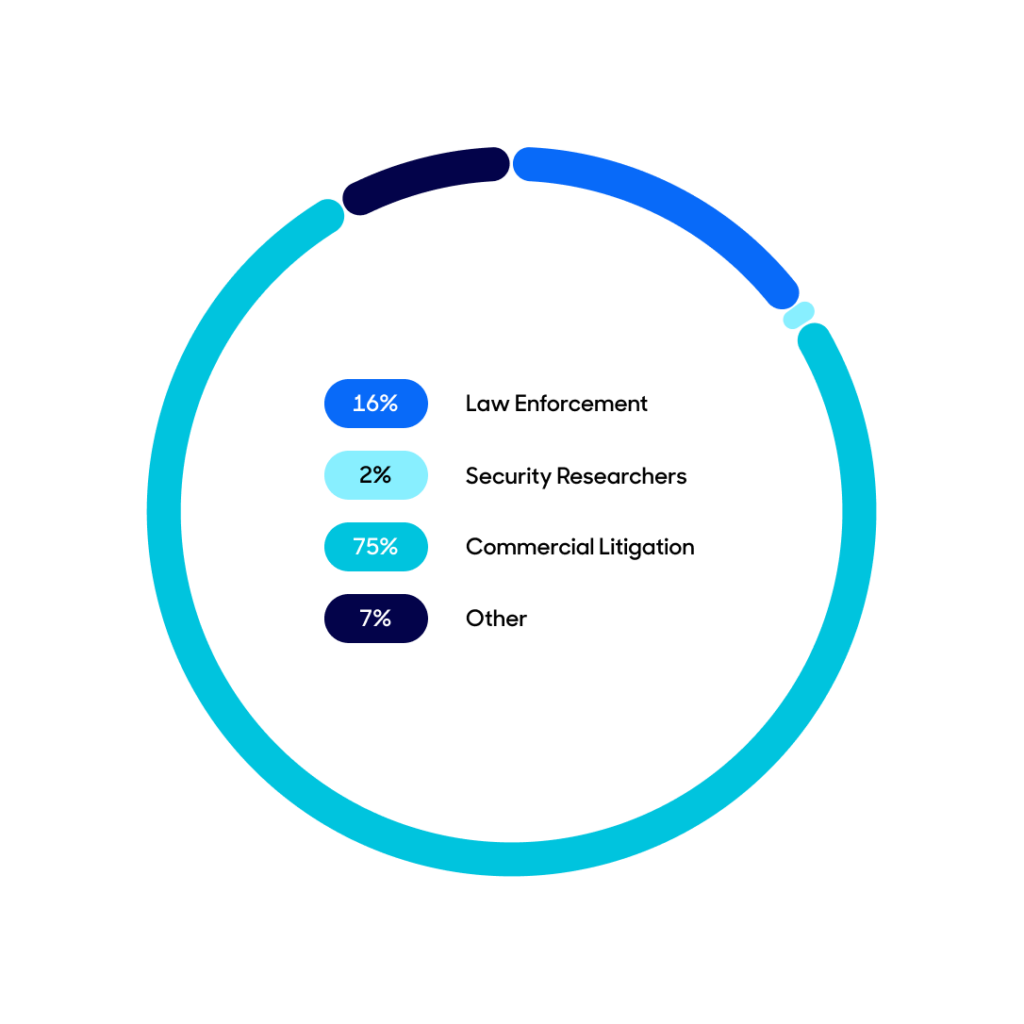
Requests by category (total)
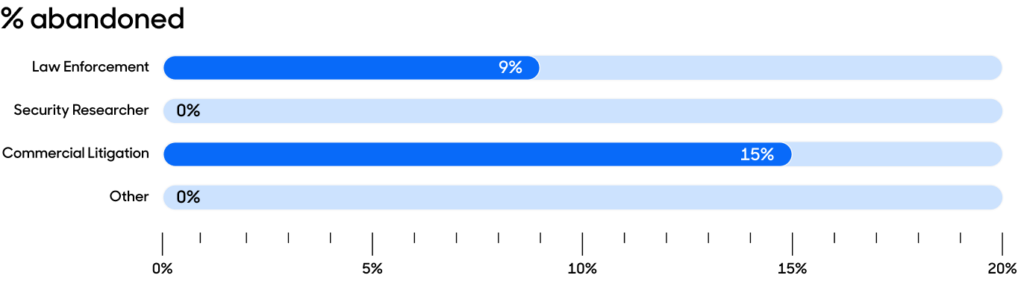
Abandoned requests by requestor category (September – December 2025)
We continue to receive requests that are abandoned when we follow up to ask for more information:
LEA request locations
We received our first request from a Turkish law enforcement agency during this period.
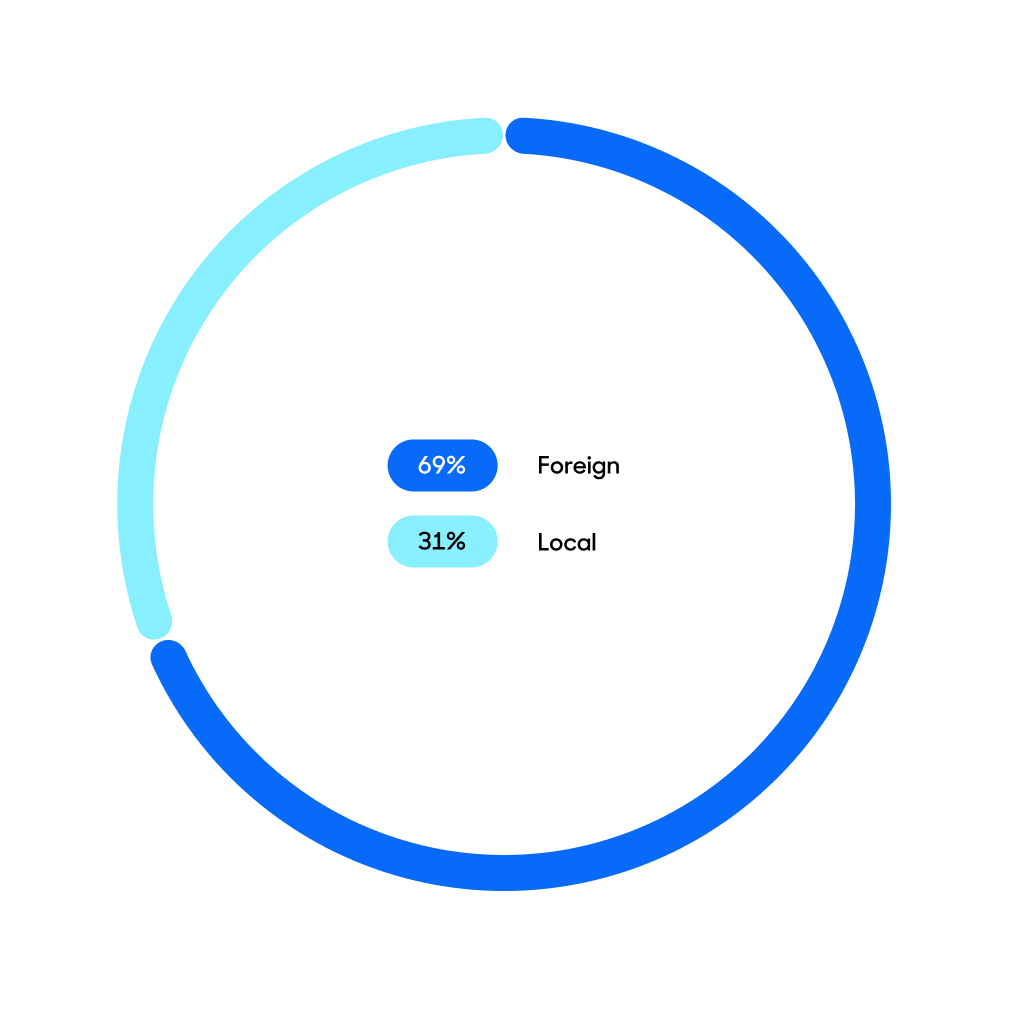
We continue to receive the bulk of our LEA requests from outside our local jurisdictions, both overall and in the new reporting period. However, in the new reporting period, the requests from local law enforcement significantly increased—from 7% last period to 31% this period. This is primarily due to an increased number of requests from German law enforcement. We don’t know whether this indicates a stronger German focus on cybercrime, whether they’re more heavily leveraging registration data, or if something else is contributing. In any case, we’re pleased to be able to help them where we can.
LEA request origin (local vs foreign) – overall
LEA request origin (local vs foreign) – new period
Local LEA request breakdown (overall)
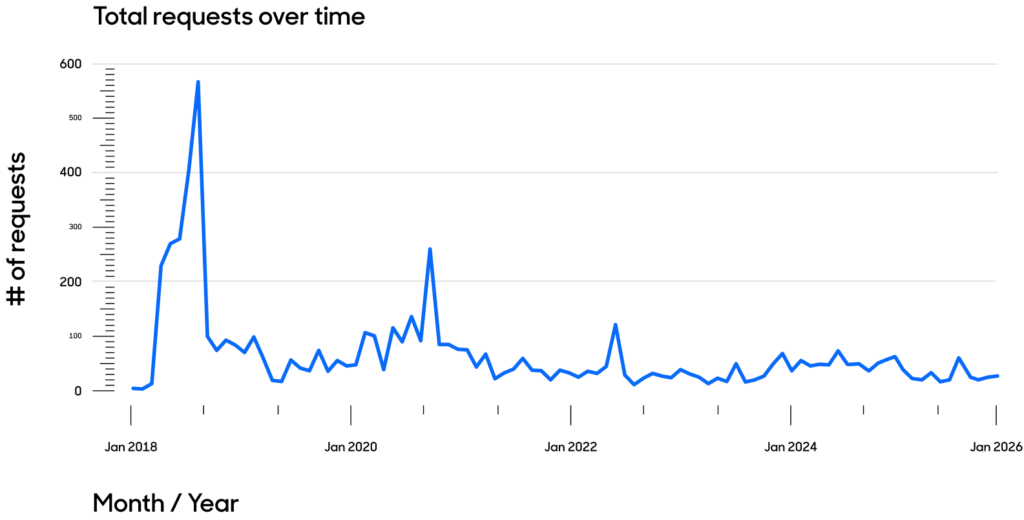
Total requests over time
To read our past Tiered Access blog posts, please see:
- OpenSRS’ Tiered Access Directory: a Look at the Numbers (May 2018 – mid-February 2019)
- Tiered Access Data Disclosure Update (mid-February – mid-October 2019)
- Privacy and Lawful Access to Personal Data at Tucows (mid-October 2019 – end of February 2020)
- Whois History and Updated Tiered Access Statistics (March – end of August 2020)
- Tiered Access request review process and updated statistics (September 2020 – end of August 2021)
- Tiered Access update: refreshed statistics and law enforcement processes (August – December 2021)
- Tiered Access update: registration data accuracy, and updated statistics (January – April 2022)
- Tiered Access update and thoughts on due process (May – August 2022)
- TACO Platform Updates (November 2022)
- Tiered Access update: policy check-in and updated statistics (September – December 2022)
- Tiered Access update: centralized system development, and updated statistics (January – April 2023)
- Tiered Access update: “urgent” disclosure requests and updated statistics (May – August 2023)
- Tiered Access update: RDRS first experiences and updated statistics (September – December 2023)
- Tiered Access update: law enforcement (foreign and local) and fresh 2024 statistics (January – April 2024)
- Tiered Access update: RDRS, security and LEA requests, and updated statistics (May – August 2024)
- Tiered Access update: RDRS participation and updated statistics (September – December 2024)
- Tiered Access update: Reviewing “urgent” requests and updated statistics (January – April 2025)
- Tiered Access update: Privacy services, proxy registrants, and updated statistics | OpenSRS (May – August 2025)
1Note that we include this data in every TACO stats post (in “Requests by requestor category,” formatted to focus on which type of request was most common). We have included this line chart to clearly highlight how the rates have changed over time.