Tiered Access Directory (TACO)
Tiered Access update: insights on abandonment and updated statistics
We share our latest TACO request stats from January 1 through April 30, 2026 and explain why requests missing information end up abandoned.
As we prepare for ICANN87 in Bali, Indonesia, here’s your regularly-scheduled data-dump about TACO requests.
First, a note about our June 2026 TACO stats post. Human error resulted in the post including a truncated data set; it reflected the period from January only through March instead of through to the end of April 2026. That post will be adjusted to reflect correct data; please accept my apology for any confusion this caused.
Requests without sufficient information: abandoned requests
Part of the reason we created the TACO platform was that we were initially flooded with requests for previously-public registration data—and most of those requests did not include sufficient information for us to appropriately review those requests. We began a campaign of education, including working with the Registrar Stakeholder Group to publish a list of exactly what we need: Minimum Required Information for Whois Data Requests.
Whenever we get requests that are missing data, we respond that we need more data (and outline what we need) and mark these as “requested more information.” When we receive the missing information, we update the request with the result: we provided registration data or we didn’t, after reviewing the full request. When we don’t receive the missing information, these become “abandoned” requests.

We always require the same set of information in disclosure requests; at a high level, we need to know who the requestor is, on whose behalf they are making the request (as this is often different), what domain name they need data for, and why that data will resolve their issue. We also make sure that they provide assurances that they are being truthful in their request, that their request is legal in their jurisdiction, and that they will treat the personal data that we may provide to them with appropriate safeguards.
When a request is incomplete, we ask for the missing information so we can evaluate the requestor's legitimate interest against the registrant's privacy rights and our own legal obligations. Since we cannot adequately consider the balance of rights without this information, the request remains in a pending or abandoned status until it's provided. Processing requests efficiently and effectively is important to us as well as to the requestors, so it’s nice to see the abandonment rate dropping over time.
Our review of a sample of these incomplete requests challenges some easy-to-make assumptions. Abandoned requests happen with all types of requestors: law enforcement (including representatives of government departments), copyright holders, business owners, and security professionals. We’ve had an environmental ministry tell us that a website using a domain registered with us is violating the law without indicating which domain or what data they need from us. Advocates ask for information to address copyright infringement without showing that they represent the copyright holder—or without even claiming to do so. Law enforcement agents who are very familiar with our processes sometimes try to look up domains without submitting a request first and then get confused when the search fails. Although we didn't get any in this reporting period, we also hear from security researchers who tell us they need access to our entire database for “research” without providing a reason that so much personal data should be shared with them.
Taken all together, this suggests that these parties were either able to find the information elsewhere, or they determined it wasn't necessary; otherwise the requests would not have been abandoned.
Again, we’re pleased that the abandonment rate has decreased over time but wanted to take this opportunity to explain what that number means in our regular posts. And now—the data!
Tiered access statistics: 1 May - 31 August 2026
We received 170 requests in this period, bringing the total since we began tracking to 6962.
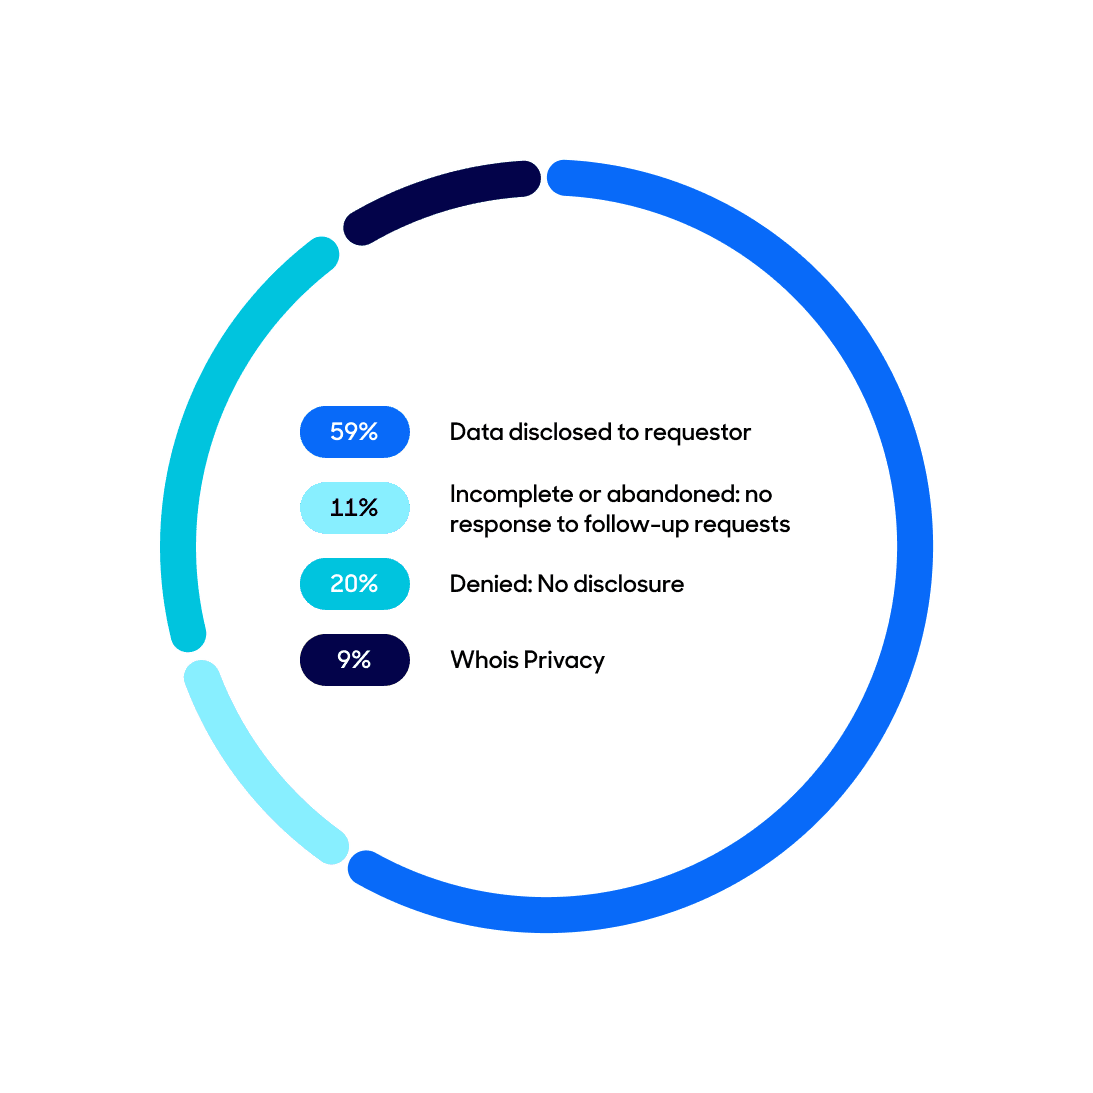
Data disclosure request outcomes: new period (May - August 2026)


Urgent requests
We shared data about Urgent requests earlier this year and intend to continue tracking them.
We received thirteen requests in this period marked as Urgent; none of them met the definition of a circumstance that should be treated as an Urgent request for disclosure of registration data.
We received one request in this period which actually met the definition of Urgent; this request was not marked as Urgent.

Requests by requestor category
Requests by category: new period (May - August 2026)
Law enforcement requests were once again the largest requestor category in the reporting period, continuing to outnumber Commercial Litigation.
The “Other” category was busier than usual this period, with registrants looking to access their own domains, third parties wanting to contact registrants, and various concerns about website content, which should be directed to the website owner or hosting provider.

Requests by category since 2018

Requests by category (total)

Abandoned requests by requestor category (May - August 2026)

LEA request locations
We continue to receive the bulk of our LEA requests from outside our local jurisdictions, both overall and in the new reporting period, with no requests from new jurisdictions in this reporting period.


The top five requesting countries, which make up just over 55% of our LEA requests, are (in order of request volume) India, Spain, Germany, Costa Rica, and France. Of these countries, only Germany is considered local to us.
LEA request origin (local vs. foreign) - new period

LEA request origin (local vs. foreign) - overall

Local LEA request breakdown (overall)

Total requests over time

To read our past Tiered Access blog posts, please see:
OpenSRS’ Tiered Access Directory: a Look at the Numbers (May 2018 – mid-February 2019)
Tiered Access Data Disclosure Update (mid-February – mid-October 2019)
Privacy and Lawful Access to Personal Data at Tucows (mid-October 2019 – end of February 2020)
Whois History and Updated Tiered Access Statistics (March – end of August 2020)
Tiered Access request review process and updated statistics (September 2020 – end of August 2021)
Tiered Access update: refreshed statistics and law enforcement processes (August – December 2021)
Tiered Access update: registration data accuracy and updated statistics (January – April 2022)
Tiered Access update and thoughts on due process (May - August 2022)
TACO Platform Updates (November 2022)
Tiered Access update: policy check-in and updated statistics (September - December 2022)
Tiered Access update: centralized system development and updated statistics (January - April 2023)
Tiered Access update: “urgent” disclosure requests and updated statistics (May - August 2023)
Tiered Access update: RDRS first experiences and updated statistics (September - December 2023)
Tiered Access update: law enforcement (foreign and local) and fresh 2024 statistics (January - April 2024)
Tiered Access update: RDRS, security and LEA requests, and updated statistics (May - August 2024)
Tiered Access update: RDRS participation and updated statistics (September - December 2024)
Tiered Access update: Reviewing “urgent” requests and updated statistics (January - April 2025)
Tiered Access update: Privacy services, proxy registrants, and updated statistics (May - August 2025)
Tiered Access update: A year-over-year review and updated statistics (September - December 2025)
Tiered Access update: CP Summit recap and fresh statistics (January - April 2026)